A study was conducted to test the effectiveness of supermarket sales strategies. At one supermarket, the price level (regular, reduced price, and at cost to supermarket) and display level (normal display space, normal display space plus end-of-aisle display, and twice the normal display space) were tested to determine if they had any effect on the weekly sales of a particular supermarket product. Each of the combinations of price level and display level were put in place for a randomly selected week and the weekly sales of the product was recorded. Each combination was used three times over the course of the experiment. The results of the study are shown here: 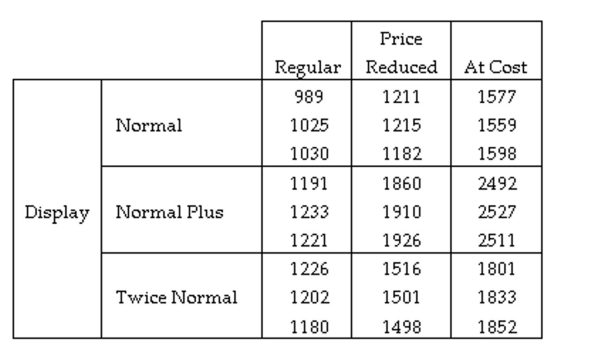
Find the test statistic for determining whether the interaction between Price and Display is significant.
A) 1709.37
B) 3121.89
C) 495
D) 257.93
Correct Answer:
Verified
Q16: A scientist is hoping to compare the
Q17: A study was conducted to test
Q18: A study was conducted to test the
Q19: Which procedure was specifically developed for pairwise
Q20: A study was conducted to test
Q22: In a completely randomized design experiment,
Q23: Psychologists have found that people are
Q24: Find the critical value F0 for
Q25: Psychologists have found that people are
Q26: Four brands of baseball bats were
Unlock this Answer For Free Now!
View this answer and more for free by performing one of the following actions

Scan the QR code to install the App and get 2 free unlocks

Unlock quizzes for free by uploading documents