The box plot shown below was constructed for the amount of soda that was poured by a filling machine into 12-ounce soda cans at a local soda bottling company. 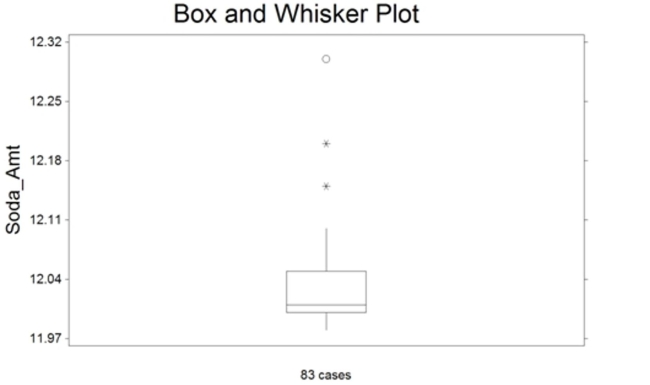
We see that one soda can received 12.30 ounces of soda on the plot above. Based on the box plot
Presented, how would you classify this observation?
A) it has a lot of soda
B) highly suspect outlier
C) expected observation
D) suspect outlier
Correct Answer:
Verified
Q13: In an eye color study, 25 out
Q14: Which number on the screen below is
Q15: 260 randomly sampled college students were asked,
Q16: Calculate the variance of a sample
Q17: One of the questions posed to a
Q19: At the U.S. Open Tennis Championship a
Q20: Calculate the standard deviation of a
Q21: The range of scores on a statistics
Q22: At the U.S. Open Tennis Championship a
Q23: The amount spent on textbooks for the
Unlock this Answer For Free Now!
View this answer and more for free by performing one of the following actions

Scan the QR code to install the App and get 2 free unlocks

Unlock quizzes for free by uploading documents