A dot plot of the speeds of a sample of 50 cars passing a policeman with a radar gun is shown below. 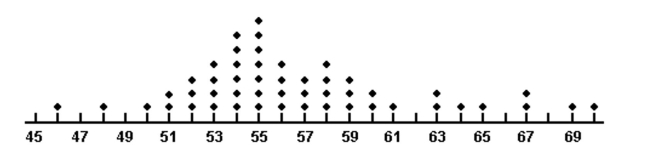
What proportion of the motorists were driving above the posted speed limit of 55 miles per hour?
A) 0.64
B) 0.50
C) 0.14
D) 7
Correct Answer:
Verified
Q30: The table shows the number of
Q31: The amount spent on textbooks for the
Q32: Which of the following is a measure
Q33: The amount spent on textbooks for the
Q34: Parking at a university has become a
Q37: At the U.S. Open Tennis Championship a
Q39: The temperature fluctuated between a low of
Q40: The amount of time workers spend commuting
Q160: The z-score for a value x is
Q183: Explain how using a scale break on
Unlock this Answer For Free Now!
View this answer and more for free by performing one of the following actions

Scan the QR code to install the App and get 2 free unlocks

Unlock quizzes for free by uploading documents