True/False
The scatterplot below shows a negative relationship between two variables. 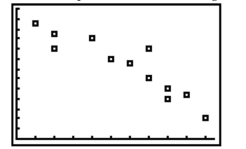
Correct Answer:
Verified
Related Questions
Q78: In skewed distributions, the mean is the
Q105: Q106: What number is missing from the Q107: The output below displays the mean Q108: Compute s2 and s for the Q109: The following is a list of Q111: The scores for a statistics test Q112: The speeds of the fastballs thrown by Q113: Given a data set, which of the Q115: The mean ![]()
Unlock this Answer For Free Now!
View this answer and more for free by performing one of the following actions

Scan the QR code to install the App and get 2 free unlocks

Unlock quizzes for free by uploading documents