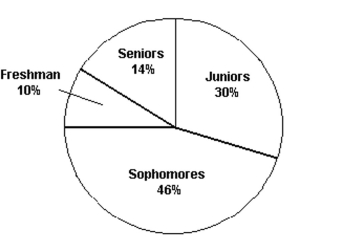
The pie chart shows the classifications of students in a statistics class. What percentage of the class consists of freshman, sophomores, and juniors?
A) 44%
B) 14%
C) 86%
D) 54%
Correct Answer:
Verified
Q31: All class intervals in a histogram have
Q36: For large data sets, a stem-and-leaf display
Q96: A larger standard deviation means greater variability
Q123: Both Chebyshevʹs rule and the empirical rule
Q141: According to the empirical rule, z-scores of
Q146: Many firms use on-the-job training to teach
Q147: Many firms use on-the-job training to teach
Q148: What number is missing from the
Q150: In practice, the population mean µ
Q151: On a given day, the price of
Unlock this Answer For Free Now!
View this answer and more for free by performing one of the following actions

Scan the QR code to install the App and get 2 free unlocks

Unlock quizzes for free by uploading documents