The box plot shown below displays the amount of soda that was poured by a filling machine into 12-ounce soda cans at a local bottling company. 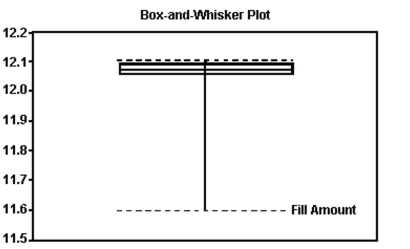
Based on the box plot, what shape do you believe the distribution of the data to have?
A) skewed to the right
B) approximately symmetric
C) skewed to the left
D) skewed to the center
Correct Answer:
Verified
Q13: The bars in a bar graph can
Q35: A histogram can be constructed using either
Q72: In general, the sample mean is a
Q155: The process for finding a percentile is
Q157: The mean of a data set is
Q178: A shoe retailer keeps track of
Q180: The outer fences of a box plot
Q180: Which of the following is not a
Q185: The distribution of scores on a test
Q188: Fill in the blank. One advantage of
Unlock this Answer For Free Now!
View this answer and more for free by performing one of the following actions

Scan the QR code to install the App and get 2 free unlocks

Unlock quizzes for free by uploading documents