(Situation E) A machine at K-Company fills boxes with bran flake cereal. The target weight for the filled boxes is 24 ounces. The company would like to use control charts to monitor the performance of the machine. The company decides to sample and weigh 10 consecutive boxes of cereal at randomly selected times over a two-week period. Twenty measurement times are selected and the following information is recorded.
-Does the following control chart represent a process that is in control or out of control? If it is out of control, explain how you arrived at this conclusion. 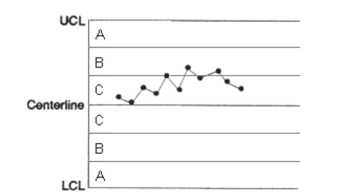
Correct Answer:
Verified
View Answer
Unlock this answer now
Get Access to more Verified Answers free of charge
Q12: The upper and lower control limits are
Q13: The process of monitoring and eliminating variation
Q14: (Situation B) A manufacturing company makes
Q15: The capability index for a process
Q16: Does the following control chart represent a
Q18: The primary goal of quality-improvement activities is
A)
Q19: A process is considered capable if
Q20: (Situation D) A walk-in freezer thermostat
Q21: The quality of a product is indicated
Q22: (Situation C) Ten samples of
Unlock this Answer For Free Now!
View this answer and more for free by performing one of the following actions

Scan the QR code to install the App and get 2 free unlocks

Unlock quizzes for free by uploading documents