A fast food chain test marketing a new sandwich chose 18 of its stores in one major
metropolitan area. Nine of the stores were in malls and nine were free standing. The sandwich was offered at three different introductory prices. The table shows the number of new sandwiches sold at each location for each location type and price combination.
Number of New Sandwiches Sold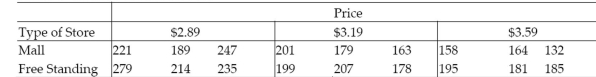
a. Write a model for the mean number of sandwiches sold, , assuming that the relationship between and price, , is first-order.
b. Fit the model to the data.
c. Write the prediction equations for mall and free-standing stores.
d. Do the data provide sufficient evidence that the change in number of sandwiches sold with respect to price is different for mall and free-standing stores? Use .
Correct Answer:
Verified
View Answer
Unlock this answer now
Get Access to more Verified Answers free of charge
Q36: It is desired to build a
Q37: In regression, it is desired to predict
Q38: Consider the interaction model
Q39: A study of the top MBA
Q40: A study of the top MBA
Q42: The concessions manager at a beachside
Q43: In Hawaii, proceedings are under way
Q44: In any production process in which
Q45: The model Q46: A college admissions officer proposes to
Unlock this Answer For Free Now!
View this answer and more for free by performing one of the following actions

Scan the QR code to install the App and get 2 free unlocks

Unlock quizzes for free by uploading documents