The time series graph below shows annual sales figures (in thousands of dollars)
For a well known department store chain. The dominant component in these data is 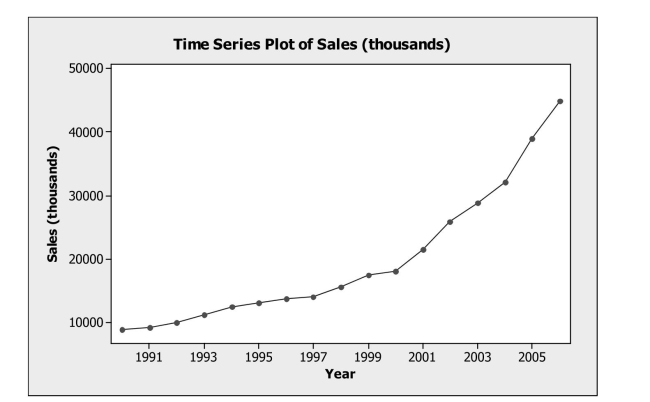
A) Trend
B) Seasonal
C) Randomness
D) Irregular
E) Error
Correct Answer:
Verified
Q14: Data were collected for a sample
Q15: Which of the following measures is used
Q16: A linear regression model was fit
Q17: Stock prices and earnings per share
Q18: The following is output from regression
Q20: The model predicted
Q21: Based on the actual and forecasted
Q22: Which statement about influential points is true?
I.
Q23: In order to examine if there
Q24: In order to examine if the size
Unlock this Answer For Free Now!
View this answer and more for free by performing one of the following actions

Scan the QR code to install the App and get 2 free unlocks

Unlock quizzes for free by uploading documents