The time series graph below shows monthly sales figures for a specialty gift item
Sold on the Home Shopping Network (HSN) . The dominant component in these data is 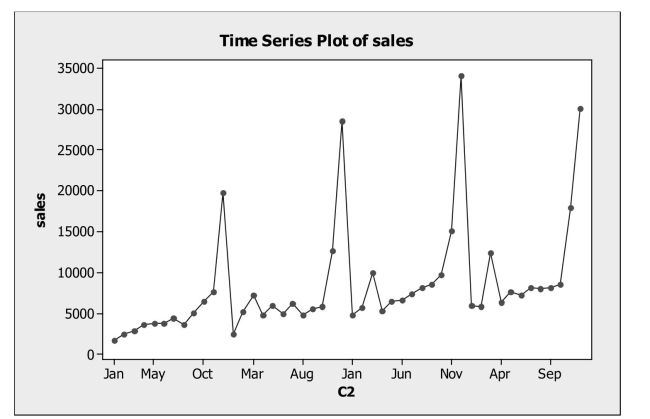
A) Cyclical
B) Seasonal
C) Randomness
D) Irregular
E) Error
Correct Answer:
Verified
Q27: A large pharmaceutical company selected a
Q28: The residual plot for a linear regression
Q29: A large pharmaceutical company selected a
Q30: Weekly commodity prices for heating oil (in
Q32: Based on returns for the last
Q33: Weekly commodity prices for heating oil
Q34: For many countries tourism is an
Q35: For many countries tourism is an
Q36: In order to examine if there
Q79: A farmer has increased his wheat production
Unlock this Answer For Free Now!
View this answer and more for free by performing one of the following actions

Scan the QR code to install the App and get 2 free unlocks

Unlock quizzes for free by uploading documents