Analyze scatterplots and correlation coefficients.
-A consumer research group examining the relationship between the price of meat (per
Pound) and fat content (in grams) gathered data that produced the following scatterplot.
If the point in the lower left hand corner (2 grams of fat; $3.00 per pound) is removed, the
Correlation would most likely 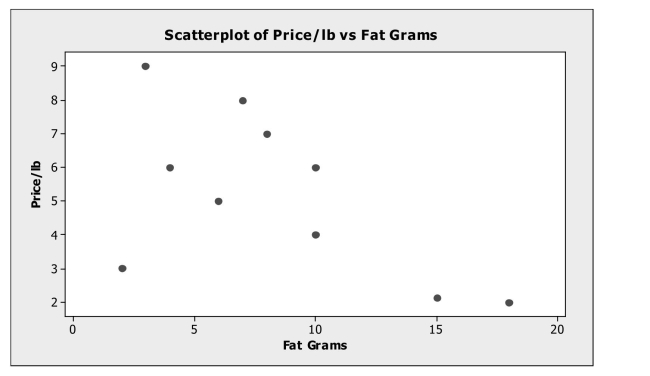
A) remain the same.
B) become positive.
C) become weaker negative.
D) become stronger negative.
E) become zero.
Correct Answer:
Verified
Q24: Interpret a linear regression equation and use
Q25: Interpret the value of correlation coefficients
Q26: Interpret the value of correlation coefficients
Q27: Understand the relationship between the correlation and
Q28: Analyze scatterplots and correlation coefficients.
-A small independent
Q30: Analyze residuals.
-Based on the following residual plot,
Q31: Interpret a linear regression equation and use
Q32: Write and interpret a linear regression
Q33: Interpret a linear regression equation and use
Q34: Check conditions for correlation and linear regression.
-A
Unlock this Answer For Free Now!
View this answer and more for free by performing one of the following actions

Scan the QR code to install the App and get 2 free unlocks

Unlock quizzes for free by uploading documents