Describe displays of distributions.
-Below is a histogram of salaries (in $) for a sample of U.S. marketing managers. The
Most appropriate measure of central tendency for these data is the 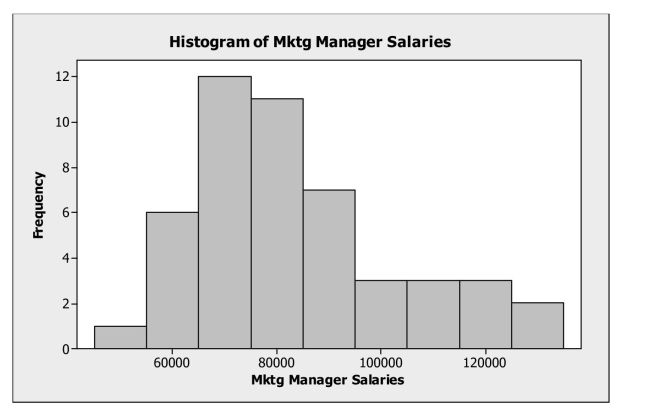
A) median.
B) mean.
C) mode.
D) range.
E) standard deviation.
Correct Answer:
Verified
Q10: Analyze data of quantitative variables.
-The following
Q11: Interpret summary statistics.
-Based on the five
Q12: Analyze data of quantitative variables.
-The following
Q13: Analyze scatterplots and correlation coefficients.
-Suppose the marketing
Q14: Compare results using standardization.
-The following table
Q16: Interpret displays of distributions.
-The following boxplots show
Q17: The following table shows closing share
Q18: Data were collected on the hourly wage
Q19: Describe displays of distributions.
-Below is a histogram
Q20: The ASQ (American Society for Quality) regularly
Unlock this Answer For Free Now!
View this answer and more for free by performing one of the following actions

Scan the QR code to install the App and get 2 free unlocks

Unlock quizzes for free by uploading documents