Determine when a linear model is appropriate for data.
-Monthly closing stock prices for a utility company were obtained from January 2007
Through August 2008. A regression model was estimated to describe the trend in closing
Stock prices over time. What does the plot of residuals below suggest? 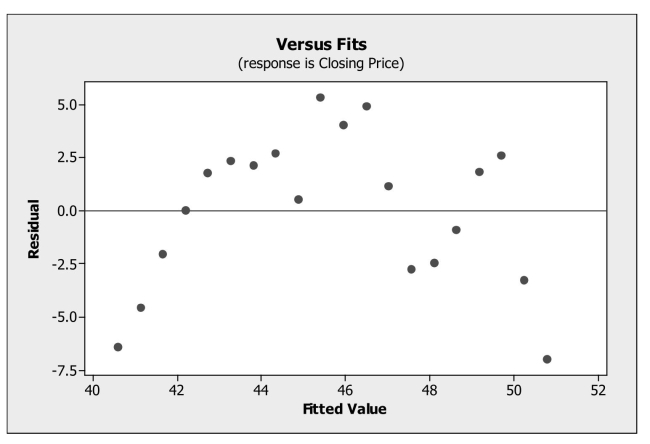
A) An outlier is present in the data set.
B) The linearity condition is not satisfied.
C) A high leverage point is present in the data set.
D) The data are not normal.
E) The equal spread condition is not satisfied.
Correct Answer:
Verified
Q1: Recognize unusual or extraordinary points.
-Suppose a regression
Q2: Determine when a linear model is appropriate
Q3: Quarterly sales figures for e-commerce retail sales
Q5: Determine when a linear model is appropriate
Q6: Examining residuals for groups.
-A medical researcher was
Q7: Examining residuals for groups.
-A medical researcher was
Q8: Perform statistical inference for multiple regression.
-The advertising
Q9: Recognize the presence of autocorrelation in residuals.
-Quarterly
Q10: Re-express data to make them appropriate for
Q11: Monthly closing stock prices for a utility
Unlock this Answer For Free Now!
View this answer and more for free by performing one of the following actions

Scan the QR code to install the App and get 2 free unlocks

Unlock quizzes for free by uploading documents