Determine when a linear model is appropriate for data.
-A linear regression model was estimated to describe the trend in world population over
Time. Below is the plot of residuals versus predicted values. What does the plot of
Residuals suggest? 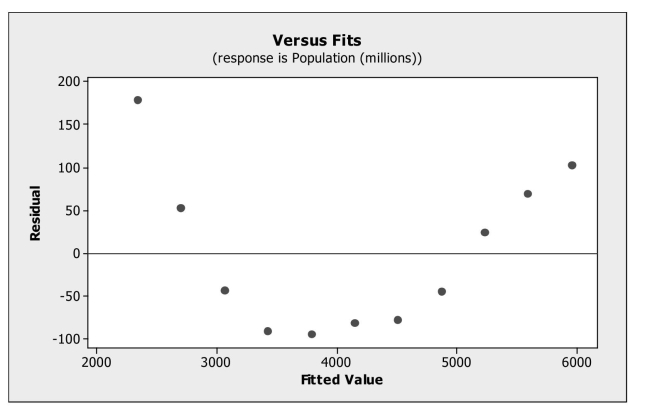
A) An outlier is present in the data set.
B) The linearity condition is not satisfied.
C) A high leverage point is present in the data set.
D) The data are not normal.
E) The equal spread condition is not satisfied.
Correct Answer:
Verified
Q12: Recognize an extrapolation.
-Data on internet usage (per
Q13: Data on labor productivity and unit labor
Q14: A regression model was developed relating average
Q15: Data on internet usage (per 100 inhabitants)
Q16: Recognize the presence of autocorrelation in residuals.
-Monthly
Q18: Understand how working with summary values affects
Q19: Re-express data to make them appropriate for
Q20: Re-express data to make them appropriate for
Q21: Recognize unusual or extraordinary points.
-Which of the
Q22: Recognize an extrapolation.
-The advertising campaign for a
Unlock this Answer For Free Now!
View this answer and more for free by performing one of the following actions

Scan the QR code to install the App and get 2 free unlocks

Unlock quizzes for free by uploading documents