Interpret a scatterplot.
-An operations manager was interested in determining if there is a relationship between
The amount of training received by production line workers and the time it takes for them
To trouble shoot a process problem. A sample of recently trained line workers was
Selected. The number of hours of training time received and the time it took (in minutes)
For them to trouble shoot their last process problem were captured. Based on the
Scatterplot of the data shown below, we can say that 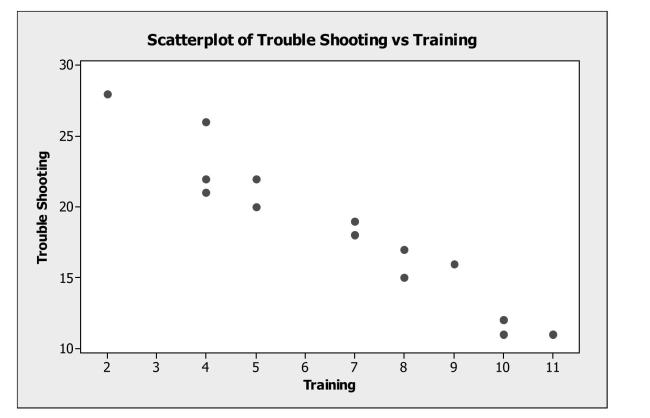
A) The slope of the regression line fit to these data will be positive.
B) The slope of the regression line fit to these data will be negative.
C) The linearity assumption is not satisfied.
D) The intercept of the regression line fit to these data will be negative.
E) The equal variance assumption is not satisfied.
Correct Answer:
Verified
Q1: Interpret regression output.
-A sales manager was
Q2: Interpret a confidence interval for the slope
Q4: Create a confidence interval for the
Q5: Test for association.
-As the carbon content in
Q6: Create a confidence interval for the
Q7: Interpret regression output.
-A sales manager was
Q9: Consider the following to answer the question(s)
Q10: Consider the following to answer the question(s)
Q10: The confidence interval and prediction interval
Q11: Is there a significant relationship between sales
Unlock this Answer For Free Now!
View this answer and more for free by performing one of the following actions

Scan the QR code to install the App and get 2 free unlocks

Unlock quizzes for free by uploading documents