Look at the utility function graphed below and select the type of decision maker that corresponds to the graph.
A) Risk averter
B) Risk neutral
C) Risk taker
D) Risk player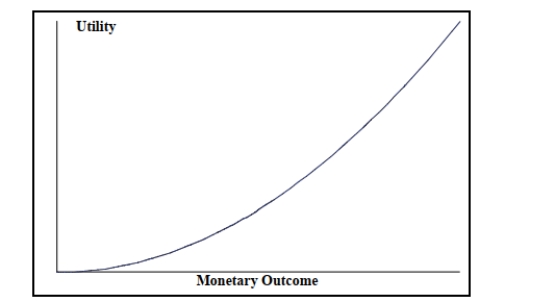
Correct Answer:
Verified
Q55: For a potential investment of $5,000,a portfolio
Q57: SCENARIO 19-2
The following payoff matrix is
Q58: SCENARIO 19-3
The following information is from
Q60: SCENARIO 19-2
The following payoff matrix is
Q63: In a local cellular phone area, company
Q63: At Eastern University, 60% of the students
Q64: Opportunity loss is the difference between the
Q65: SCENARIO 19-3
The following information is from
Q66: In a local cellular phone area, company
Q76: _ is a procedure for revising probabilities
Unlock this Answer For Free Now!
View this answer and more for free by performing one of the following actions

Scan the QR code to install the App and get 2 free unlocks

Unlock quizzes for free by uploading documents