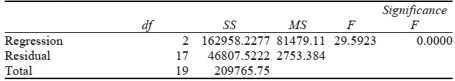
SCENARIO 17-2 One of the most common questions of prospective house buyers pertains to the cost of heating in dollars . To provide its customers with information on that matter, a large real estate firm used the following 4 variables to predict heating costs: the daily minimum outside temperature in degrees of Fahrenheit , the amount of insulation in inches , the number of windows in the house , and the age of the furnace in years . Given below are the EXCEL outputs of two regression models.
Model 1
-Referring to Scenario 17-2, what is the value of the partial F test statistic for ?
A) 0.820
B) 1.219
C) 1.382
D) 15.787
Correct Answer:
Verified
Q85: SCENARIO 17-1
A real estate builder wishes
Q86: SCENARIO 17-1
A real estate builder wishes
Q87: SCENARIO 17-1
A real estate builder wishes
Q88: SCENARIO 17-2 One of the most
Q89: SCENARIO 17-1
A real estate builder wishes
Q91: SCENARIO 17-1
A real estate builder wishes
Q92: SCENARIO 17-1
A real estate builder wishes
Q93: SCENARIO 17-2 One of the most
Q94: SCENARIO 17-2 One of the most
Q95: SCENARIO 17-1
A real estate builder wishes
Unlock this Answer For Free Now!
View this answer and more for free by performing one of the following actions

Scan the QR code to install the App and get 2 free unlocks

Unlock quizzes for free by uploading documents