SCENARIO 17-13
The table below contains the sparklines for the rates of return (in percentage) for three different stocks
from 2007 to 2013. 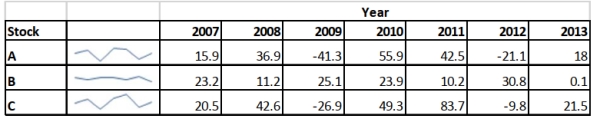
-Referring to Scenario 17-13, the sparklines enable you to draw conclusions
on the historical trend of the rates of return of the three stocks.
Correct Answer:
Verified
Q10: In real-world business analytics,filtering is typically performed
Q24: Data mining uses various techniques to extract
Q60: Successful implementation of a classification tree requires
Q354: SCENARIO 17-13
The table below contains the sparklines
Q356: SCENARIO 17-14
The treemap below shows the amounts
Q357: SCENARIO 17-13
The table below contains the sparklines
Q358: SCENARIO 17-14
The treemap below shows the amounts
Q360: SCENARIO 17-14
The treemap below shows the amounts
Q361: SCENARIO 17-15
The tree diagram below shows the
Q364: SCENARIO 17-15
The tree diagram below shows the
Unlock this Answer For Free Now!
View this answer and more for free by performing one of the following actions

Scan the QR code to install the App and get 2 free unlocks

Unlock quizzes for free by uploading documents