SCENARIO 17-13
The table below contains the sparklines for the rates of return (in percentage) for three different stocks
from 2007 to 2013. 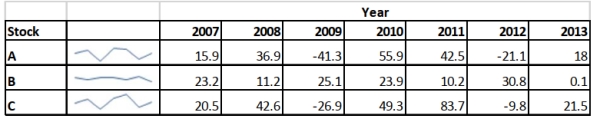
-Referring to Scenario 17-13, the sparklines enable you to conclude that the
rates of return of the stock market in general is volatile from 2007 to 2013.
Correct Answer:
Verified
Q3: Some business analytics involve starting with many
Q21: Which of the following is NOT one
Q32: There is no significant difference between filtering
Q35: Which of the following is NOT one
Q345: SCENARIO 17-14
The treemap below shows the amounts
Q346: SCENARIO 17-14
The treemap below shows the amounts
Q347: SCENARIO 17-14
The treemap below shows the amounts
Q349: SCENARIO 17-13
The table below contains the sparklines
Q350: SCENARIO 17-14
The treemap below shows the amounts
Q351: SCENARIO 17-13
The table below contains the sparklines
Unlock this Answer For Free Now!
View this answer and more for free by performing one of the following actions

Scan the QR code to install the App and get 2 free unlocks

Unlock quizzes for free by uploading documents