SCENARIO 14-16
What are the factors that determine the acceleration time (in sec.) from 0 to 60 miles per hour of a
car? Data on the following variables for 30 different vehicle models were collected: (Accel Time): Acceleration time in sec.
(Engine Size): c.c.
(Sedan): 1 if the vehicle model is a sedan and 0 otherwise
The regression results using acceleration time as the dependent variable and the remaining variables as the independent variables are presented below.
ANOVA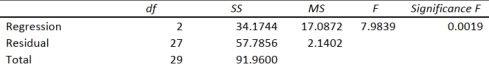
-Referring to Scenario 14-16, ________ of the variation in Accel Time can be explained by the
dummy variable Sedan while controlling for the other independent variable.
Correct Answer:
Verified
Q207: SCENARIO 14-17
Given below are results from the
Q211: SCENARIO 14-17
Given below are results from the
Q213: SCENARIO 14-17
Given below are results from the
Q219: SCENARIO 14-17
Given below are results from the
Q248: SCENARIO 14-16 What are the factors that
Q250: SCENARIO 14-16 What are the factors that
Q253: SCENARIO 14-16
What are the factors that
Q254: SCENARIO 14-16
What are the factors that
Q259: SCENARIO 14-17
Given below are results from
Q260: SCENARIO 14-16
What are the factors that
Unlock this Answer For Free Now!
View this answer and more for free by performing one of the following actions

Scan the QR code to install the App and get 2 free unlocks

Unlock quizzes for free by uploading documents