SCENARIO 14-20-A
You are the CEO of a dairy company. You are planning to expand milk production by purchasing
additional cows, lands and hiring more workers. From the existing 50 farms owned by the company,
you have collected data on total milk production (in liters) , the number of milking cows, land size (in
acres) and the number of laborers. The data are shown below and also available in the Excel file
Scenario14-20-DataA.XLSX.
S 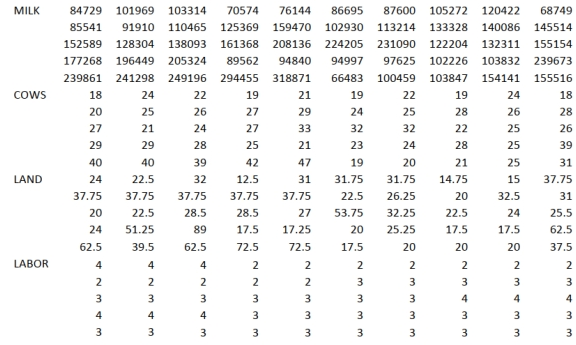
You believe that the number of milking cows , land size and the number of laborers are the best predictors for total milk production on any given farm.
-Referring to Scenario 14-20-A, which of the following is a correct interpretation for the adjusted r-square?
A) 89.50% of the total variation in total milk production can be explained by the number of milking cows, the land size and the number of laborers.
B) 89.50% of the total variation in total milk production can be explained by the number of milking cows, the land size and the number of laborers after adjusting for the level of
Significance
C) 89.50% of the total variation in total milk production can be explained by the number of milking cows, the land size and the number of laborers holding constant the effect of all
The independent variables.
D) 89.50% of the total variation in total milk production can be explained by the number of milking cows, the land size and the number of laborers after adjusting for the number of
Predictors and sample size.
Correct Answer:
Verified
Q324: SCENARIO 14-20-A
You are the CEO of
Q325: SCENARIO 14-20-A
You are the CEO of
Q326: SCENARIO 14-20-A
You are the CEO of
Q330: SCENARIO 14-20-A
You are the CEO of
Q331: SCENARIO 14-20-A
You are the CEO of
Q332: SCENARIO 14-20-A
You are the CEO of
Q333: SCENARIO 14-19
The marketing manager for a
Q334: SCENARIO 14-19 The marketing manager for a
Q334: SCENARIO 14-19
The marketing manager for a
Q335: SCENARIO 14-19 The marketing manager for a
Unlock this Answer For Free Now!
View this answer and more for free by performing one of the following actions

Scan the QR code to install the App and get 2 free unlocks

Unlock quizzes for free by uploading documents