Data has been collected and a normal probability plot for one of the variables is shown below. Based on your knowledge of normal probability plots, do you believe the variable in question is normally distributed? The data are represented by the"o" symbols in the plot. 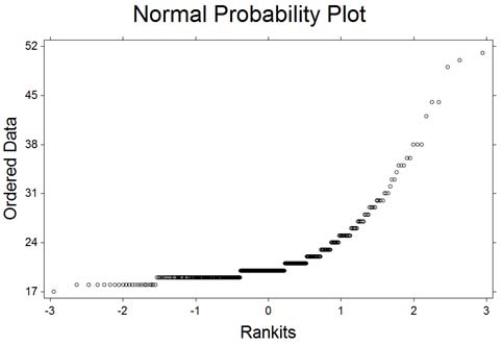
A) Yes. The plot reveals a straight line and this indicates the variable is normally distributed.
B) No. The plot does not reveal a straight line and this indicates the variable is not normally distributed.
C) Yes. The plot reveals a curve and this indicates the variable is normally distributed.
Correct Answer:
Verified
Q81: The following data represent the scores
Q82: Determine if it is appropriate to use
Q83: Assume that x is a binomial random
Q84: A study of college students stated that
Q85: IQ test scores are normally distributed with
Q87: If a data set is normally distributed,
Q88: Assume that x is a binomial random
Q89: The printout below contains summary statistics
Q90: A statistician received some data to
Q91: Which of the following is not
Unlock this Answer For Free Now!
View this answer and more for free by performing one of the following actions

Scan the QR code to install the App and get 2 free unlocks

Unlock quizzes for free by uploading documents