260 randomly sampled college students were asked, among other things, to state their year in school (freshman, sophomore, junior, or senior) . The responses are shown in the bar graph below. How many of the students who responded would be classified as upperclassmen (e.g., juniors or seniors) ? 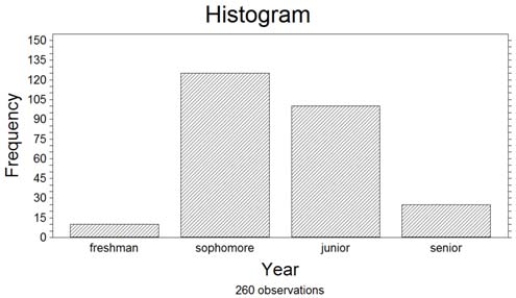
A) Approximately 100
B) Approximately 125
C) Approximately 10
D) Approximately 25
Correct Answer:
Verified
Q2: A sample of 100 e-mail users were
Q6: The table shows the number of
Q8: The table shows the number of
Q9: Complete the frequency table for the
Q12: What characteristic of a Pareto diagram distinguishes
Q13: The bars in a bar graph can
Q14: The slices of a pie chart must
Q14: One of the questions posed to a
Q15: A frequency table displays the proportion of
Q16: What number is missing from the
Unlock this Answer For Free Now!
View this answer and more for free by performing one of the following actions

Scan the QR code to install the App and get 2 free unlocks

Unlock quizzes for free by uploading documents