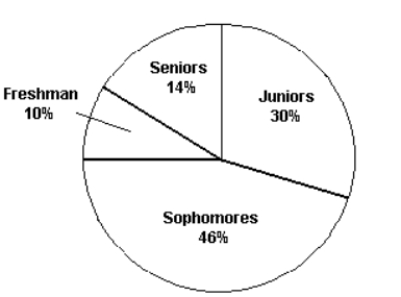
 The pie chart shows the classifications of students in a statistics class. What percentage of the class consists of freshman, sophomores, and juniors?
A) 86%
B) 14%
C) 44%
D) 54%
Correct Answer:
Verified
Q1: Q1: Either vertical or horizontal bars can be Q2: The data below show the types Q6: The table shows the number of Q8: The table shows the number of Q9: Complete the frequency table for the Q11: 260 randomly sampled college students were asked, Q13: The bars in a bar graph can Q14: The slices of a pie chart must Q20: If 25% of your statistics class is![]()
Unlock this Answer For Free Now!
View this answer and more for free by performing one of the following actions

Scan the QR code to install the App and get 2 free unlocks

Unlock quizzes for free by uploading documents