The side-by-side boxplots show the cumulative college GPAs for sophomores, juniors, and
Seniors taking an intro stats course in Autumn 2003.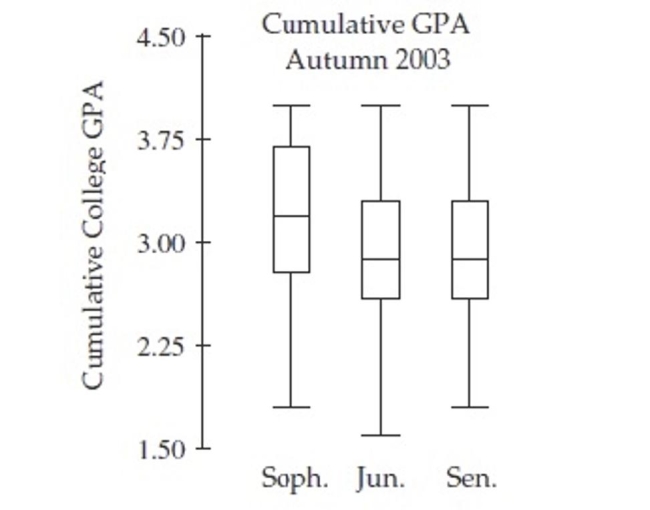
Which class has the most skewed set of GPAs?
A) Sophomore
B) Junior
C) Senior
D) Both Junior and Senior
Correct Answer:
Verified
Q4: On the right are two dotplots made
Q5: One thousand students from a local university
Q6: The boxplots show prices of used cars
Q7: The side-by-side boxplots show the cumulative college
Q8: A few of the male students are
Q10: The following boxplots show monthly sales revenue
Q11: The following boxplots show monthly sales revenue
Q12: The side-by-side boxplots show the cumulative college
Q13: The side-by-side boxplots show the cumulative college
Q14: One thousand students from a local university
Unlock this Answer For Free Now!
View this answer and more for free by performing one of the following actions

Scan the QR code to install the App and get 2 free unlocks

Unlock quizzes for free by uploading documents