The scatterplot shows monthly sales figures (in units) and number of months of experience For a sample of salespeople. 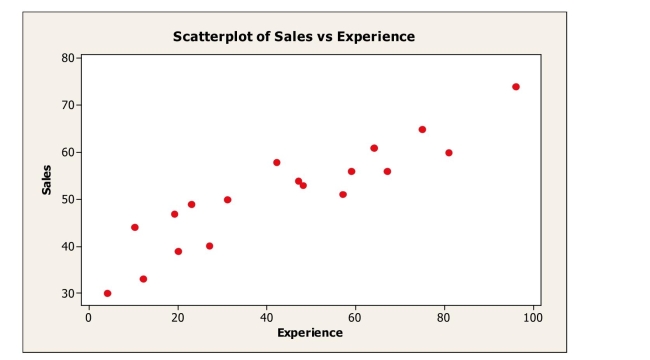
The correlation between monthly sales and level of experience is most likely
A) -.235.
B) 0.
C) .180.
D) -.914.
E) .914.
Correct Answer:
Verified
Q2: On the axes below, sketch a scatterplot
Q3: The scatterplot shows monthly sales figures (in
Q4: The National Sleep Foundation reported a moderately
Q5: Shown below is a correlation table
Q6: Given the increase of people carrying their
Q8: A correlation of zero between two quantitative
Q9: For the following scatterplot, Q10: The following scatterplot shows a relationship between Q11: A scatterplot of Q12: A small independent organic food store offers![]()
Unlock this Answer For Free Now!
View this answer and more for free by performing one of the following actions

Scan the QR code to install the App and get 2 free unlocks

Unlock quizzes for free by uploading documents