This double-bar graph shows the number of male (M) and female (F) athletes at a university over a four-year period.
Answer the question. 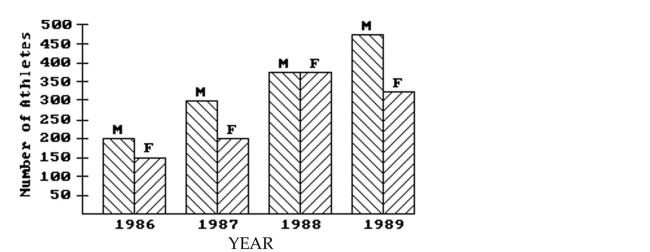
-Which year had the greatest number of male athletes?
A) 1988
B) 1989
C) 1986
D) 1987
Correct Answer:
Verified
Q19: Construct a frequency polygon.
-
Q20: Construct the specified histogram.
-The frequency table
Q21: Answer the question.
-The bar graph below shows
Q22: Use this graph to answer the question.
Q23: Use this graph to answer the question.
Q25: Use this graph to answer the question.
Q26: Answer the question.
-The bar graph below
Q27: Construct a stem and leaf display
Q28: Use this graph to answer the question.
Q29: Answer the question.
-The bar graph below shows
Unlock this Answer For Free Now!
View this answer and more for free by performing one of the following actions

Scan the QR code to install the App and get 2 free unlocks

Unlock quizzes for free by uploading documents