Solve the problem.
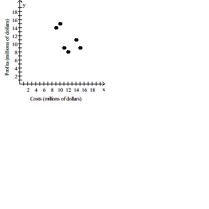
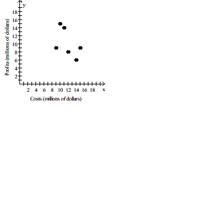
-The table below shows the legal costs and the profits of a company from 2000 to 2005. Construct a scatter diagram for the data and state whether legal costs and profits for this company have no correlation, a positive correlation, or a negative correlation for this period.
A) Positive correlation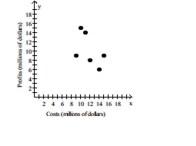
B) Positive correlation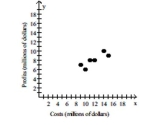
C) No correlation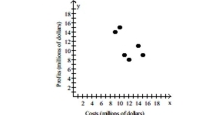
D) Negative correlation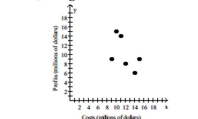
Correct Answer:
Verified
Q4: Select the best estimate of the correlation
Q5: Solve the problem.
-The table below shows
Q6: State whether there is no correlation, a
Q7: State whether you believe the two variables
Q8: State whether you believe the two variables
Q10: State whether you believe the two variables
Q11: Select the best estimate of the correlation
Q12: Select the best estimate of the correlation
Q13: Provide an appropriate response.
-Estimate the coordinates
Q14: State whether there is no correlation, a
Unlock this Answer For Free Now!
View this answer and more for free by performing one of the following actions

Scan the QR code to install the App and get 2 free unlocks

Unlock quizzes for free by uploading documents