The histogram shows the weights of 314 hockey players. Over the histogram, draw a smooth curve that captures its general features. Then classify the distribution according to its number of modes and its symmetry or skewness. In words, summarize the meaning of your results. 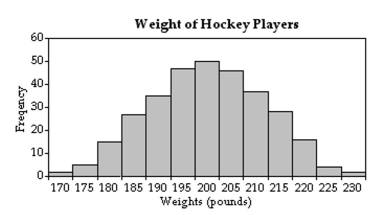
Correct Answer:
Verified
View Answer
Unlock this answer now
Get Access to more Verified Answers free of charge
Q54: State how many modes you would expect
Q55: The histogram shows the weights (in grams)of
Q56: State how many modes you would expect
Q57: State how many modes you would expect
Q58: The table below provides a frequency
Q61: Find the range for the given
Q62: Find the standard deviation for the given
Q63: Identify the distribution as symmetric, left-skewed, or
Q64: Identify the distribution as symmetric, left-skewed, or
Q96: State how many peaks you would expect
Unlock this Answer For Free Now!
View this answer and more for free by performing one of the following actions

Scan the QR code to install the App and get 2 free unlocks

Unlock quizzes for free by uploading documents