Solve the problem.
-A car dealer is deciding what kinds of vehicles he should order from the factory. His sales report for the preceding period is shown below. Construct a Pareto chart to represent the sales of each type of vehicle as percentages.
A) 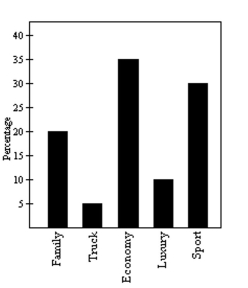
B) 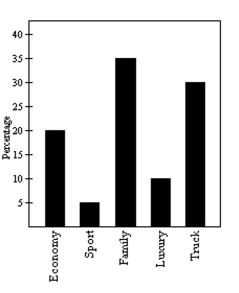
C) 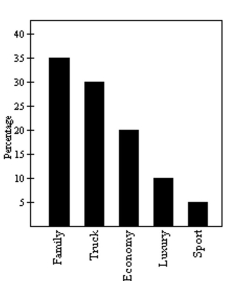
D) 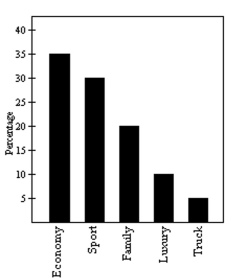
Correct Answer:
Verified
Q28: A nurse measured the blood pressure of
Q29: Make a bar graph to represent
Q30: A nurse measured the blood pressure of
Q31: Solve the problem.
-Wagenlucht Ice Cream Company is
Q33: Make a bar graph to represent
Q34: A nurse measured the blood pressure of
Q35: Solve the problem.
-The Kappa Iota Sigma Fraternity
Q36: Solve the problem.
-200 casino patrons, were interviewed
Q37: Make a bar graph to represent
Q107: A nurse measured the blood pressure of
Unlock this Answer For Free Now!
View this answer and more for free by performing one of the following actions

Scan the QR code to install the App and get 2 free unlocks

Unlock quizzes for free by uploading documents