Use the graph to answer the question.
-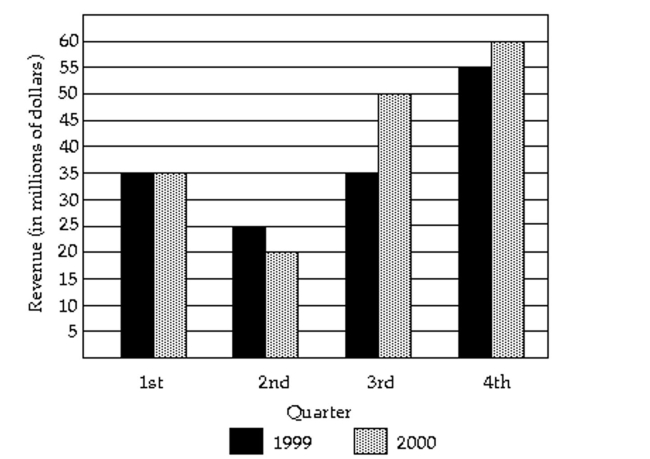 In what quarter was the revenue the least for 2000?
A) second quarter
B) fourth quarter
C) first quarter
D) third quarter
Correct Answer:
Verified
Q121: A statement is made about correlation. State
Q122: Identify the variable as either qualitative
Q123: Determine whether the study involves selection bias,
Q124: A sample statistic and margin of
Q125: Solve the problem.
-For the study described below,
Q127: Make a scatter diagram for the
Q128: Solve the problem.
-For the study described below,
Q129: The stack plot below shows the value
Q130: State whether the scatter diagram shows strong
Q131: Use the graph to answer the question.
-
Unlock this Answer For Free Now!
View this answer and more for free by performing one of the following actions

Scan the QR code to install the App and get 2 free unlocks

Unlock quizzes for free by uploading documents