A hypothesis test for a population mean is to be performed. The hypotheses are
Which of the sketches below could represent the power curve for the test?
A) 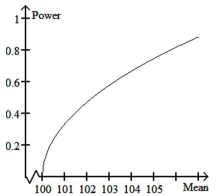
B) 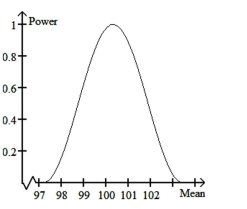
C) 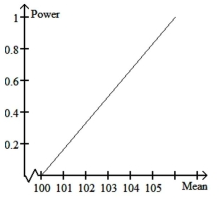
D) 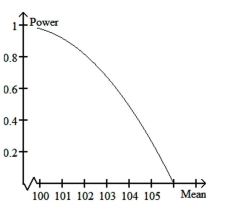
Correct Answer:
Verified
Q1: Traditionally in hypothesis testing the null hypothesis
Q2: Provide an appropriate response.
-Suppose that you wish
Q3: Provide an appropriate response.
-A right-tailed hypothesis test
Q5: A high school biology student wishes
Q6: Perform a hypothesis test for the population
Q7: Decide whether it appears reasonable to
Q8: Provide an appropriate response.
-A man is
Q9: Perform a one-sample z-test for a
Q10: A high school biology student wishes
Q11: Provide an appropriate response.
-Give an example
Unlock this Answer For Free Now!
View this answer and more for free by performing one of the following actions

Scan the QR code to install the App and get 2 free unlocks

Unlock quizzes for free by uploading documents