A hypothesis testing situation is given. The population standard deviation, sample size, and significance level are given.Complete the table to give the probability of a Type II error and the power for each of the given values of µ. Use the table to draw the power curve.
-In 1990, the average math SAT score for students at one school was 472. Five years later, a teacher wants to perform a hypothesis test to determine whether the average SAT score of students at the school has changed from the 1990 mean of 472. Preliminary data analyses indicate that it is reasonable to apply a z-test. The hypotheses are Assume that , and the significance level is . Find the probability of a Type II error and the power for . 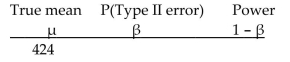 430 440 450 460 470 474 484 494 504 514 520
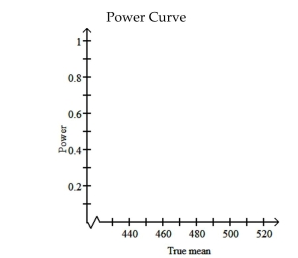
Correct Answer:
Verified
\begin{array} { r c c...
View Answer
Unlock this answer now
Get Access to more Verified Answers free of charge
Q35: When performing a one-sample z-test for a
Q36: Provide an appropriate response.
-Suppose that you want
Q37: Perform a hypothesis test for the population
Q38: Perform a one-sample z-test for a
Q39: Preliminary data analyses indicate that it
Q41: Outline the six steps involved in performing
Q42: A hypothesis testing situation is given.
Q43: Preliminary data analyses indicate that it is
Q44: Provide an appropriate response.
-A hypothesis test
Q45: Perform a hypothesis test for the population
Unlock this Answer For Free Now!
View this answer and more for free by performing one of the following actions

Scan the QR code to install the App and get 2 free unlocks

Unlock quizzes for free by uploading documents