A normal probability plot is given below for a sample of scores on an aptitude test. Use the plot to identify outliers, if any. Explain your reasoning. 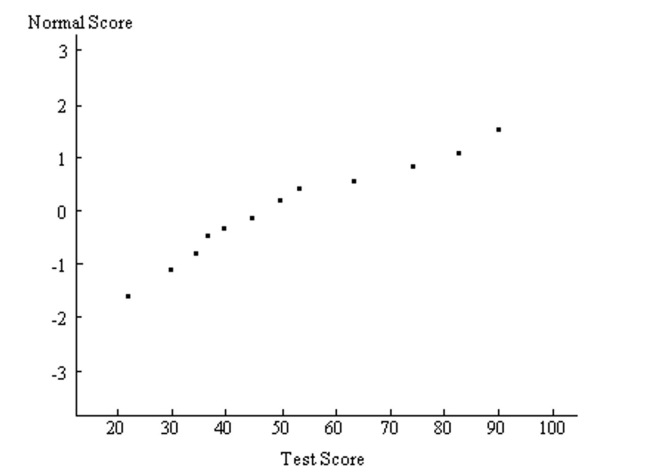
Correct Answer:
Verified
View Answer
Unlock this answer now
Get Access to more Verified Answers free of charge
Q41: Use the empirical rule to solve the
Q42: A normal probability plot is given below
Q43: Suppose that scores on a test are
Q44: Provide an appropriate response. Assume that the
Q45: Use a table of areas for the
Q47: Use a table of areas to find
Q48: Solve the problem.
-Frequency data were reported
Q49: Fill in the blanks by standardizing the
Q50: Estimate the indicated probability by using the
Q51: Choose the one alternative that best completes
Unlock this Answer For Free Now!
View this answer and more for free by performing one of the following actions

Scan the QR code to install the App and get 2 free unlocks

Unlock quizzes for free by uploading documents