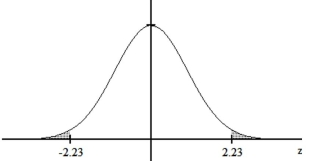
Use a table of areas to obtain the shaded area under the standard normal curve.
-
A)
B)
C)
D)
Correct Answer:
Verified
Q56: Does the presence of an outlier in
Q57: Use a sketch of the standard normal
Q58: Estimate the indicated probability by using the
Q59: Provide an appropriate response. Assume that the
Q60: Frequency data were reported for the
Q62: Use the empirical rule to solve the
Q63: Estimate the indicated probability by using the
Q64: Fill in the blanks by standardizing the
Q65: Find the indicated probability or percentage for
Q66: Use a table of areas to
Unlock this Answer For Free Now!
View this answer and more for free by performing one of the following actions

Scan the QR code to install the App and get 2 free unlocks

Unlock quizzes for free by uploading documents