The following contingency table provides a joint frequency distribution for the popular votes cast in the presidential election by region and political party. Data are in thousands, rounded to the nearest thousand. 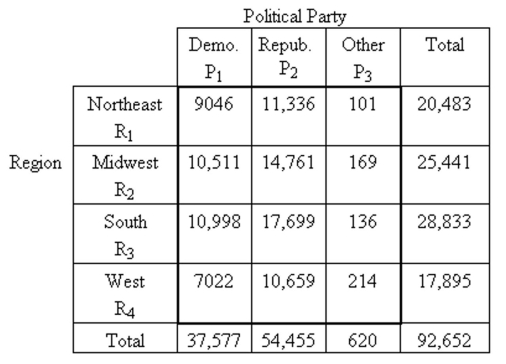 If a person who voted in the presidential election is selected at random, . Interpret this probability in terms of percentages.
Correct Answer:
Verified
View Answer
Unlock this answer now
Get Access to more Verified Answers free of charge
Q10: Provide an appropriate response.
-Discuss the differences, both
Q12: Provide an appropriate response.
-Describe an event whose
Q15: Consider the following counting problem. How many
Q16: An experiment consists of randomly selecting a
Q17: Suppose that in an election for
Q18: Interpret the following probability statement using the
Q22: Find the indicated probability by using
Q24: Construct a Venn diagram representing the
Q27: Provide an appropriate response.
-Suppose a student is
Q54: What important question must you answer before
Unlock this Answer For Free Now!
View this answer and more for free by performing one of the following actions

Scan the QR code to install the App and get 2 free unlocks

Unlock quizzes for free by uploading documents