Solve the problem.
-Describe what these boxplots tell you about the relationship between the state you live in and your salary, based on the same occupation. 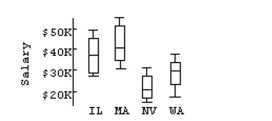
A) IL and MA have very comparable salaries. The average salaries for these states are just above $40K, and their variations are very close. NV is very comparable to IL and MA. The upper
50% of salaries for NV corresponds to the lower 50% of WA salaries.
B) IL and MA don't have very comparable salaries. The average salaries for these states are just below $40K, and their variations are different. NV is not very comparable to either IL or MA.
The upper 50% of salaries for WA corresponds to the lower 50% of NV salaries.
C) IL and MA have very comparable salaries. The average salaries for these states are just below $40K, but their variations are different. NV is not very comparable to either IL or MA. The
Upper 50% of salaries for NV corresponds to the lower 50% of WA salaries.
D) IL and MA have very comparable salaries. The average salaries for these states are just below $40K, and their variations are very close. NV is not very comparable to either IL or MA. The
Upper 50% of salaries for NV corresponds to the lower 50% of WA salaries.
Correct Answer:
Verified
Q46: Identify potential outliers, if any, for
Q47: Find the z-score corresponding to the given
Q48: Find the range for the given data
Q49: Determine the quartile or interquartile range
Q50: Find the mode(s)for the given sample
Q52: Find the mean for the given sample
Q53: Determine the quartile or interquartile range
Q54: Solve the problem.
-A variable x has
Q55: Provide an appropriate response.
-The amount of
Q56: Provide an appropriate response.
-The heights of
Unlock this Answer For Free Now!
View this answer and more for free by performing one of the following actions

Scan the QR code to install the App and get 2 free unlocks

Unlock quizzes for free by uploading documents