Solve the problem.
-Here are 3 boxplots of weekly gas prices at a service station in the United States (price in $ per gallon) . Compare the distribution of prices over the three years. 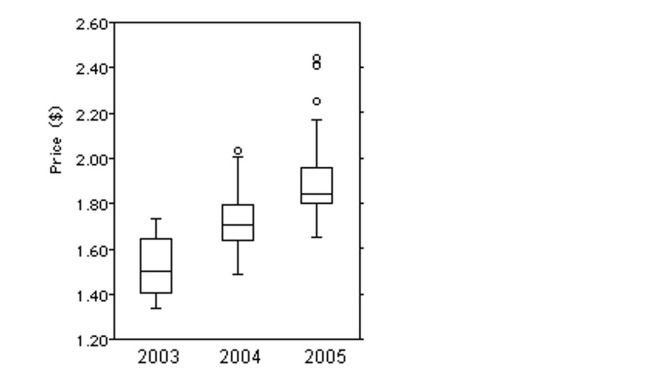
A) Gas prices have been increasing on average over the 3-year period, but the variation in the middle 50% has decreased while variation for the entire distribution has increased. The Distribution has been left-skewed, and there were 3 potential outliers in 2005.
B) Gas prices have been decreasing on average over the 3-year period, and the variation has been decreasing overall. The distribution has been left-skewed, and there were 3 potential Outliers in 2005.
C) Gas prices have been decreasing on average over the 3-year period, but the variation in the middle 50% has been increasing while variation for the entire distribution has decreased. The Distribution has been right-skewed, and there were 3 potential outliers in 2005.
D) Gas prices have been increasing on average over the 3-year period, and the variation overall has been increasing as well. The distribution has been right-skewed, and there were 3 Potential outliers in 2005.
Correct Answer:
Verified
Q151: Find the sample standard deviation for the
Q152: Find the mode(s)for the given sample
Q153: Provide an appropriate response.
-Obtain the population
Q154: Identify potential outliers, if any, for
Q155: The test scores of 40 students
Q157: Find the range for the given
Q158: Identify potential outliers, if any, for
Q159: Find the mean for the given
Q160: Consider the following data set:
Q161: A variable x has a mean, µ,
Unlock this Answer For Free Now!
View this answer and more for free by performing one of the following actions

Scan the QR code to install the App and get 2 free unlocks

Unlock quizzes for free by uploading documents