Construct and interpret a boxplot or a modified boxplot as specified.
-The highest temperatures ever recorded (in °F) in 32 different U.S. states are shown below. Construct a boxplot for the data.
A) 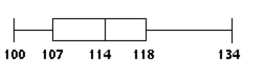
The data is slightly right-skewed.
B) 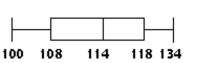
The data is fairly symmetrical.
C) 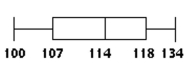
The data is fairly symmetrical.
D) 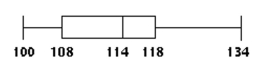
The data is slightly left-skewed.
Correct Answer:
Verified
Q185: Find the range and standard deviation
Q186: Provide an appropriate response.
-Find the z-score corresponding
Q187: Provide an appropriate response.
-The manager of
Q188: Find the sample standard deviation for the
Q189: Find the median for the given
Q190: Find the sample standard deviation for the
Q191: Find the range for the given
Q192: Solve the problem.
-The mean of a set
Q194: Consider the following sample of exam
Q195: Solve the problem. If necessary, round
Unlock this Answer For Free Now!
View this answer and more for free by performing one of the following actions

Scan the QR code to install the App and get 2 free unlocks

Unlock quizzes for free by uploading documents