A television manufacturer sold three times as many televisions in 1995 as it did in 1985. To illustrate this fact, the manufacturer draws a pictogram as shown below. The television on the right is three times as tall and three times as wide as the television on the left. 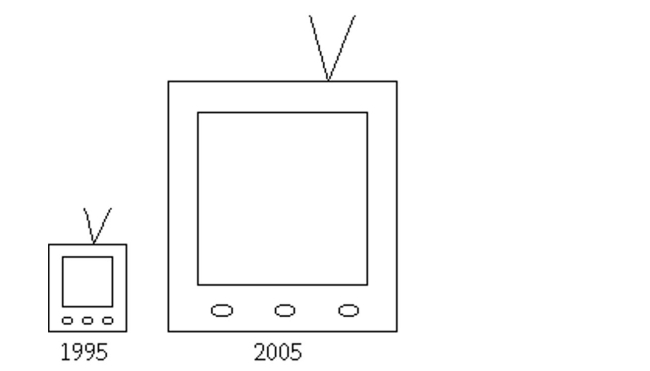 This pictogram is misleading because it actually gives the visual impression that nine times as many televisions were sold in 2005 as in 1995. How can the manufacturer correctly illustrate the fact that sales in 2005 were three times sales in 1995?
Correct Answer:
Verified
View Answer
Unlock this answer now
Get Access to more Verified Answers free of charge
Q1: The table contains the frequency and
Q2: Construct the requested histogram.
-The table below
Q3: Use cutpoint grouping to organize these
Q4: Use cutpoint grouping to organize these
Q6: Given the following "data scenario," decide which
Q7: The bar graph below shows the average
Q8: Use cutpoint grouping to organize these
Q9: Given the following "data scenario," decide which
Q10: Maria constructed the frequency distribution shown
Q11: When organizing data into tables, what is
Unlock this Answer For Free Now!
View this answer and more for free by performing one of the following actions

Scan the QR code to install the App and get 2 free unlocks

Unlock quizzes for free by uploading documents