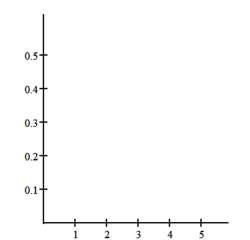
Construct the requested histogram.
-The table gives the frequency distribution for the data involving the number of television sets per household for a sample of 100 U.S. households.
Construct a relative frequency histogram. 
Correct Answer:
Verified
Q3: Provide an appropriate response.
-Suppose you are comparing
Q21: The results of a survey about
Q22: Construct the requested histogram.
-During the quality
Q23: Use cutpoint grouping to organize these
Q24: A high school teacher keeps a record
Q25: Provide an appropriate response.
-A parcel delivery service
Q27: Provide an appropriate response.
-The bar graph below
Q28: Use limit grouping to organize these
Q29: Use cutpoint grouping to organize these
Q30: Shortly before a mayoral election, a
Unlock this Answer For Free Now!
View this answer and more for free by performing one of the following actions

Scan the QR code to install the App and get 2 free unlocks

Unlock quizzes for free by uploading documents