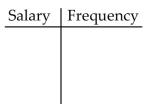
Use cutpoint grouping to organize these data into a frequency distribution.
-A government researcher was interested in the starting salaries of humanities graduates. A random sample of 30 humanities graduates yielded the following annual salaries. Data are in thousands of dollars, rounded to the nearest hundred dollars. Construct a frequency distribution for these annual starting salaries. Use 20 as the first cutpoint and classes of equal width 4 . 
Correct Answer:
Verified
Q36: Suppose that you want to construct
Q38: Provide an appropriate response.
-The heights of adult
Q40: Construct the requested histogram.
-The table gives
Q42: Suppose that you want to construct
Q43: Provide an appropriate response.
-Explain in your own
Q44: Provide an appropriate response.
-A table of random
Q45: Construct the requested histogram.
-In a survey,
Q46: A random sample of federal income
Q84: Explain in your own words the difference
Q94: Explain the difference between a frequency distribution
Unlock this Answer For Free Now!
View this answer and more for free by performing one of the following actions

Scan the QR code to install the App and get 2 free unlocks

Unlock quizzes for free by uploading documents