A graphical display of a data set is given. Identify the overall shape of the distribution as (roughly) bell-shaped,triangular, uniform, reverse J-shaped, J-shaped, right skewed, left skewed, bimodal, or multimodal.
-A die was rolled 200 times and a record was kept of the numbers obtained. The results are shown in the relative frequency histogram below. 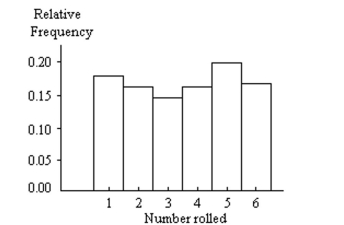
A) Left skewed
B) Triangular
C) Uniform
D) J-shaped
Correct Answer:
Verified
Q18: Determine which of the four levels of
Q78: Construct a stem-and-leaf diagram for the
Q79: Construct a pie chart representing the
Q80: Provide an appropriate response.
-The data in
Q81: Identify the variable.
-The following table gives
Q82: Construct a stem-and-leaf diagram for the
Q84: Complete the contingency table and use
Q85: Classify the data as either qualitative
Q86: A variable whose values are observed by
Q87: Construct a pie chart representing the
Unlock this Answer For Free Now!
View this answer and more for free by performing one of the following actions

Scan the QR code to install the App and get 2 free unlocks

Unlock quizzes for free by uploading documents