A graphical display of a data set is given. Identify the overall shape of the distribution as (roughly) bell-shaped,triangular, uniform, reverse J-shaped, J-shaped, right skewed, left skewed, bimodal, or multimodal.
-A relative frequency histogram for the sale prices of homes sold in one city during 2006 is shown below. 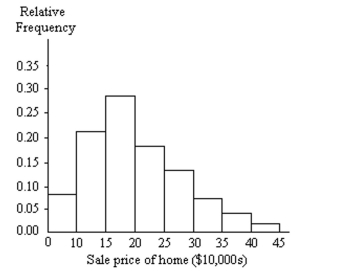
A) Reverse J-shaped
B) J-shaped
C) Left skewed
D) Right skewed
Correct Answer:
Verified
Q101: The following table gives the top
Q102: A nurse measured the blood pressure of
Q103: The following table shows the heights
Q104: Identify the variable.
-The following table gives
Q105: Identify the variable.
-For the year 2006
Q107: A nurse measured the blood pressure of
Q108: Provide the requested table entry.
-The data
Q109: The lengths (in inches)of a random
Q110: What type of data is provided by
Q111: Complete the contingency table and use
Unlock this Answer For Free Now!
View this answer and more for free by performing one of the following actions

Scan the QR code to install the App and get 2 free unlocks

Unlock quizzes for free by uploading documents