A graphical display of a data set is given. Identify the overall shape of the distribution as (roughly) bell-shaped,triangular, uniform, reverse J-shaped, J-shaped, right skewed, left skewed, bimodal, or multimodal.
-Two dice were rolled and the sum of the two numbers was recorded. This procedure was repeated 400 times. The results are shown in the relative frequency histogram below. 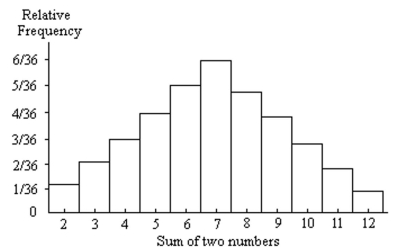
A) Right-skewed
B) Triangular
C) Left skewed
D) Bell-shaped
Correct Answer:
Verified
Q10: Identify the number
-The number of freshmen
Q108: Provide the requested table entry.
-The data
Q109: The lengths (in inches)of a random
Q110: What type of data is provided by
Q111: Complete the contingency table and use
Q112: Attendance records at a school show
Q114: The maximum recorded temperatures (in degrees
Q115: A graphical display of a data
Q116: A large record company reported the
Q117: Construct a frequency distribution for the
Unlock this Answer For Free Now!
View this answer and more for free by performing one of the following actions

Scan the QR code to install the App and get 2 free unlocks

Unlock quizzes for free by uploading documents