A graphical display of a data set is given. State whether the distribution is (roughly) symmetric, right skewed, or leftskewed.
-Two dice were rolled and the sum of the two numbers was recorded. This procedure was repeated 400 times. The results are shown in the relative frequency histogram below. 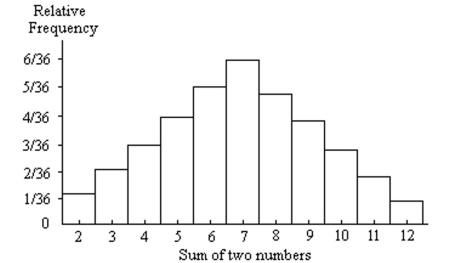
A) Left skewed
B) Symmetric
C) Right skewed
Correct Answer:
Verified
Q143: Construct a stem-and-leaf diagram for the
Q144: Construct the requested graph.
-The table lists
Q145: A graphical display of a data set
Q146: A graphical display of a data set
Q147: A graphical display of a data set
Q149: A graphical display of a data
Q150: The following table shows the average
Q151: The partially filled contingency table gives the
Q152: A nurse measured the blood pressure of
Q153: The following table shows the average
Unlock this Answer For Free Now!
View this answer and more for free by performing one of the following actions

Scan the QR code to install the App and get 2 free unlocks

Unlock quizzes for free by uploading documents