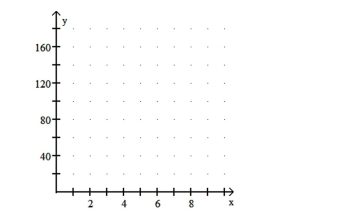
For a day's work, Chris is paid $50 to cover expenses plus $16 per hour. Let x denote the number of hours Chris works in a day and let y denote Chris's total salary for the day. Obtain the equation that expresses y in terms of x. Construct a table of values using the x-values 2, 4, and 8 hours. Draw the graph of the equation by plotting the points from the table and connecting them with a straight line. Use the graph to estimate visually Chris's salary for the day if he works 6 hours. 
Correct Answer:
Verified
View Answer
Unlock this answer now
Get Access to more Verified Answers free of charge
Q11: Explain why having a high linear correlation
Q12: Give an example of a linear equation
Q13: Define the terms "predictor variable" and "response
Q14: The variables height and weight could reasonably
Q15: Determine which scatterplot shows the strongest linear
Q17: Explain how to obtain the straight-line
Q18: For a particular regression analysis, it is
Q19: For a certain linear equation, as x
Q20: Describe what scatterplots are, and discuss their
Q21: A set of data points and
Unlock this Answer For Free Now!
View this answer and more for free by performing one of the following actions

Scan the QR code to install the App and get 2 free unlocks

Unlock quizzes for free by uploading documents