The table below shows a distribution and the observed frequencies of the values of a variable from a simple random sample of a population. Perform a chi-square goodness-of-fit test, at the specified significance level, to decide whether the distribution of the variable differs from the given distribution. 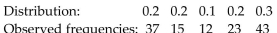
Observed frequencies: 3 Significance level
Correct Answer:
Verified
Q7: The table below shows the conditional distributions
Q8: Perform a chi-square homogeneity test, provided
Q9: The table below shows a distribution
Q10: Perform the indicated goodness-of-fit test. Be
Q11: Perform a chi-square independence test using the
Q13: When performing a chi-square goodness-of-fit test, how
Q14: Perform a chi-square homogeneity test, provided
Q15: Which of the following is not an
Q16: Explain why a chi-square goodness-of-fit test is
Q17: Perform the indicated goodness-of-fit test using the
Unlock this Answer For Free Now!
View this answer and more for free by performing one of the following actions

Scan the QR code to install the App and get 2 free unlocks

Unlock quizzes for free by uploading documents