Use the contingency table to solve the problem.
-The following contingency table shows the popular votes cast in the 1984 presidential election cross classified by region and political party. Data are in thousands, rounded to the nearest thousand. 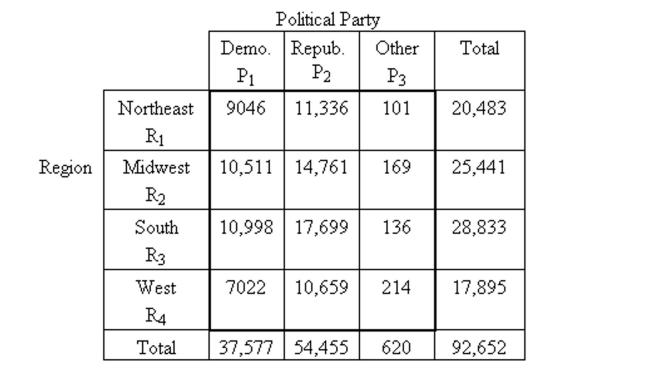 What percentage of those who voted Republican were in the South?
A) 58.8%
B) 61.4%
C) 32.5%
D) 19.1%
Correct Answer:
Verified
Q57: Perform the indicated goodness-of-fit test. Be
Q58: You have been using the chi-square test
Q59: Perform the indicated goodness-of-fit test using
Q60: A chi-square goodness-of-fit test is to
Unlock this Answer For Free Now!
View this answer and more for free by performing one of the following actions

Scan the QR code to install the App and get 2 free unlocks

Unlock quizzes for free by uploading documents