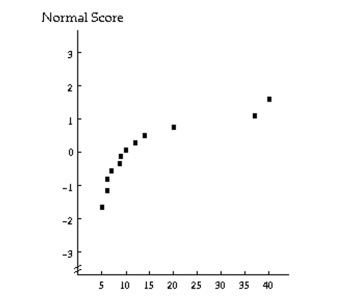
A type of sampling (independent or paired) , sample size(s) , and a figure showing the results of preliminary data analyseson the sample(s) are provided. The intent is to employ the sample data to perform a hypothesis test to compare the meansof the two populations from which the data were obtained. Use the information provided to decide which procedureshould be applied.
-Independent; and . A normal probability plot for each sample and a back-to-back stem-and-leaf diagram are given below. 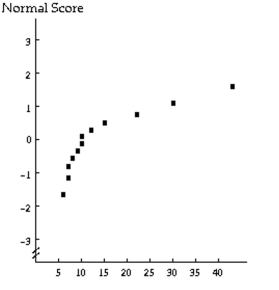
A) Paired t-test
B) Mann-Whitney test
C) Pooled t-test
D) Paired Wilcoxon signed-rank test
Correct Answer:
Verified
Q93: Suppose that
Q94: Solve the problem.
-A nutritionist wants to investigate
Q95: A type of sampling (independent or
Q96: Summary statistics are given for independent
Q97: Apply the pooled t-interval procedure to
Q98: Solve the problem.
-A variable of two
Q99: Apply the nonpooled t-interval procedure to
Q100: A type of sampling (independent or paired),
Q102: A type of sampling (independent or paired),
Q103: Use the Mann-Whitney Table to find
Unlock this Answer For Free Now!
View this answer and more for free by performing one of the following actions

Scan the QR code to install the App and get 2 free unlocks

Unlock quizzes for free by uploading documents